So, this blog is to shed light on a simple yet efficient way on how to debug JavaScript code in VSCode; and the best part is, it can be done without any extension!
Let’s get started. All you need is to do is have the latest version of vscode installed. You can get that from the official link here: Download VSCode
Prerequisites!
- You obviously should have a browser installed and preferably made as default
- You should have LiveServer Extension installed in VSCode. Or if your project already has support for deployment on a server (like Angular, React, or NodeJS) then that’s great too.
I’ve written some dummy JavaScript code for testing purposes. It’s a simple registration form with an email and password fields. You can easily find such templates on google.
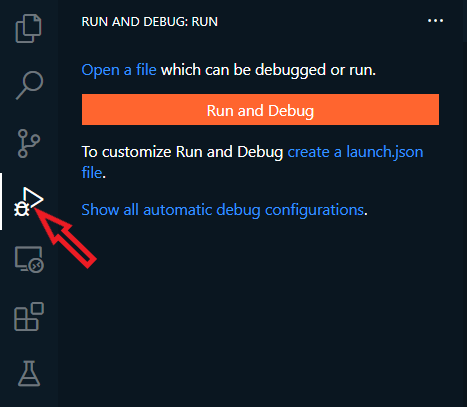
What you want to do here is simply click on the Debug button on the left bar as circled in the below picture or just hit the shortcut keys (Ctrl + Shift + D).
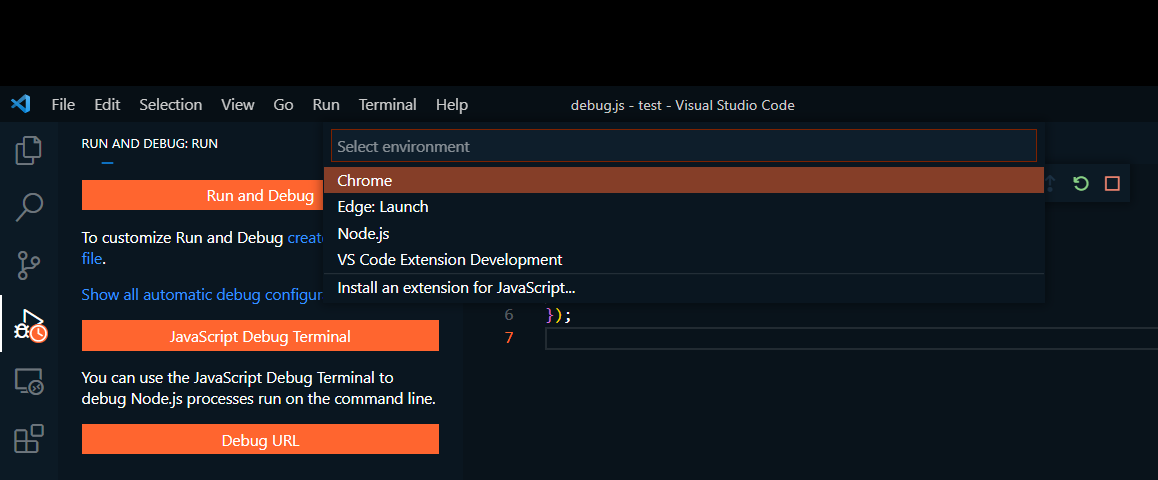
Now you have to set up the debugger so that it can open in your default browser, let’s say chrome. So, after you’ve opened the debugger side panel, you would click on the first button “Run and Debug”, which will open a dropdown window in the center, listing all the possible browsers among others where you can start debugging. Select your desired option, I’ll be selecting Chrome as shown in the picture below:
When you select a browser, it will open up the page shown below, and the only thing you need to do here is to change the port number on which your project is going to deploy at. If you’re using LiveServer Extension the port is going to be 5500. So, change it accordingly.
But before launching, make sure to add some break points at specific lines, like so.
As you can see, the debug panel on the left will show you all the variables and their values and you even get the Next, Step-Into, Step-Out options on the top bar that’s shown in the above image.
That wraps it up! Hope you guys liked this article and it helped you out with what you were looking for. If not then please leave a comment as to what you would have wanted more in this article.
Have a great one!
Recent Comments
Categories
- Angular
- AWS
- Backend Development
- Big Data
- Cloud
- Database
- Deployment
- DevOps
- Docker
- Frontend Development
- GitHub
- Google Cloud Platform
- Installations
- Java
- JavaScript
- Linux
- MySQL
- Networking
- NodeJS
- Operating System
- Python
- Python Flask
- Report
- Security
- Server
- SpringBoot
- Subdomain
- TypeScript
- Uncategorized
- VSCode
- Webhosting
- WordPress
Search
Recent Post
Understanding Mutex, Semaphores, and the Producer-Consumer Problem
- 13 October, 2024
- 10 min read
Process scheduling algorithm – FIFO SJF RR
- 14 September, 2024
- 8 min read
How to Implement Multithreading in C Language
- 8 September, 2024
- 9 min read

